
Aftercare
Know what changed. Know what it cost. Prove what you did. Aftercare records your Core Web Vitals every day, every change made to the site and every fatal error — and when an update slows the site down or breaks it, it connects the two the same day.
- Free & open source
- No account, no phoning home
- Data stays on your site
CrUX field dataLighthouse lab checksFatal error watchChange ledgerIncident alertsWP-CLI
What it helps with
Answer “why did the site just get slower?” with data instead of guesswork — built for agencies and freelancers on monthly care plans, and any site owner who wants receipts.
No account, no phoning home
LCP, INP, CLS & TTFB daily
Change timeline per incident
Lab re-test after every update
GPL-licensed. Pro adds cause attribution and client reports.
New in Aftercare
Catch the slowdown the same day — and the breakage too
Two free additions that close the gap between “a plugin updated” and “the site got worse”. Both feed the same incidents, email alerts and 72-hour change timeline you already use.
Lab checks
Re-tested 15 minutes after every update
Field data is a rolling 28-day average, so a plugin update that makes the site 40% slower can take weeks to show up — and many small sites have no Chrome UX Report record at all. Aftercare now runs its own Lighthouse lab checks, so you find out the same day.
LCP regressed 38% in the lab check 15 minutes after WP Rocket updated 3.15 to 3.16Error watch
Fatal errors and broken pages, caught
The most expensive regressions aren't slow pages, they're broken ones: a white screen after an update, or a checkout returning a 500. Aftercare now notices the breakage, not just the update that caused it.
Fatal error in woocommerce/includes/class-wc-cart.php line 412 (37 times in 2 hours)Feature set
Built for life after launch
Every site on a care plan eventually produces the same two conversations: “the site feels slower — what happened?” and “what did you actually do this month?” Aftercare answers both automatically.
Daily Core Web Vitals
Daily p75 values for LCP, INP, CLS and TTFB from the Chrome UX Report — real field data from actual Chrome users, fetched with your own free Google API key.
Real-User Monitoring Beacon
An optional ~2 KB beacon with no external libraries or services — loaded for a configurable sample of visits and aggregated to daily p75 on your own site.
Performance Budgets & Incidents
Editable budgets per metric. A daily p75 over budget — or 20% worse than your 28-day baseline — opens an incident and emails you. Lab, error and availability incidents use the same workflow, and all of them resolve automatically on recovery.
Change Ledger
Plugin, theme and core updates, activations, settings changes, publishes and new users — human-readable, with the responsible user: "WP Rocket updated 3.15 to 3.16 by admin".
Regression Forensics
Every incident shows the raw change timeline from the 72 hours before the breach, right next to the vitals trend — so "what happened?" has a data-backed answer.
Dashboard Widget & Admin Bar
Vitals status and open incidents on the main wp-admin screen, plus a pass / warn / fail dot in the admin bar so a regression is visible at a glance.
Site Health Integration
Native Site Health tests confirm vitals collection is configured, daily checks are running, lab checks reach PageSpeed Insights and no budgets are currently breached.
WP-CLI Commands
wp aftercare pull, check, status, run and lab — for scripted setups and real server crons. Action Scheduler is used automatically when available.
Private by Design
No phoning home, no accounts, no external service. CrUX and PageSpeed Insights calls go straight from your server to Google; RUM beacons post to your own REST API. Uninstall removes everything unless you opt to keep it.
How it works
Set up in under 5 minutes
Install and activate the plugin.
Create a free Google API key with the Chrome UX Report and PageSpeed Insights APIs enabled.
Paste it in Aftercare → Settings, optionally add up to 5 extra tracked URLs and enable real-user monitoring.
Press "Run daily checks now" on the dashboard — first vitals and lab data appear immediately, then update daily. Fatal error and availability watching starts on its own.
When a metric regresses, a page breaks or a fatal error appears, an incident opens, an email goes out, and the changes from the 72 hours before are lined up next to it.
WP-CLI
wp aftercare runwp aftercare pull · wp aftercare check · wp aftercare statuswp aftercare lab [--page=<url>] [--runs=<n>]Point a real server cron at wp aftercare run and skip WP-Cron entirely. Action Scheduler is used automatically when another plugin provides it.
Privacy and footprint
Screenshots
A clear view of vitals, changes and incidents
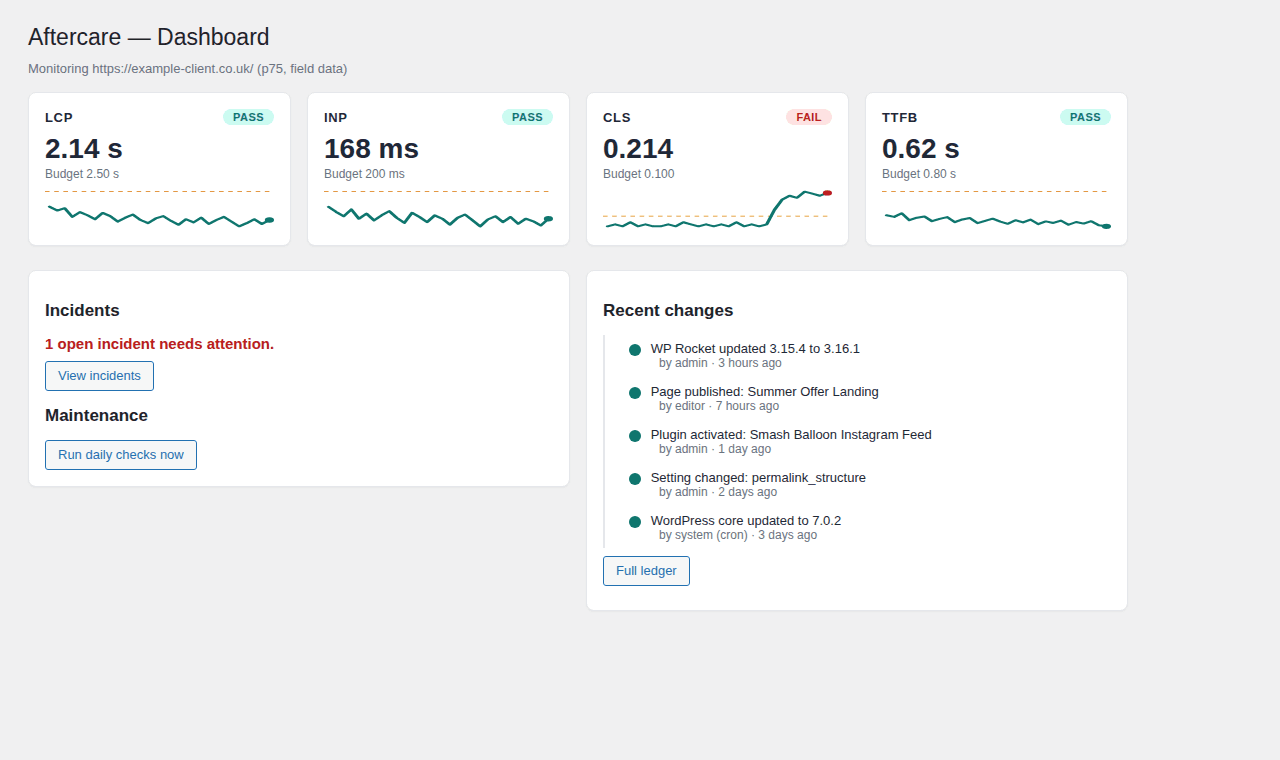
Dashboard
Vitals cards with budgets, sparklines, incidents and recent changes
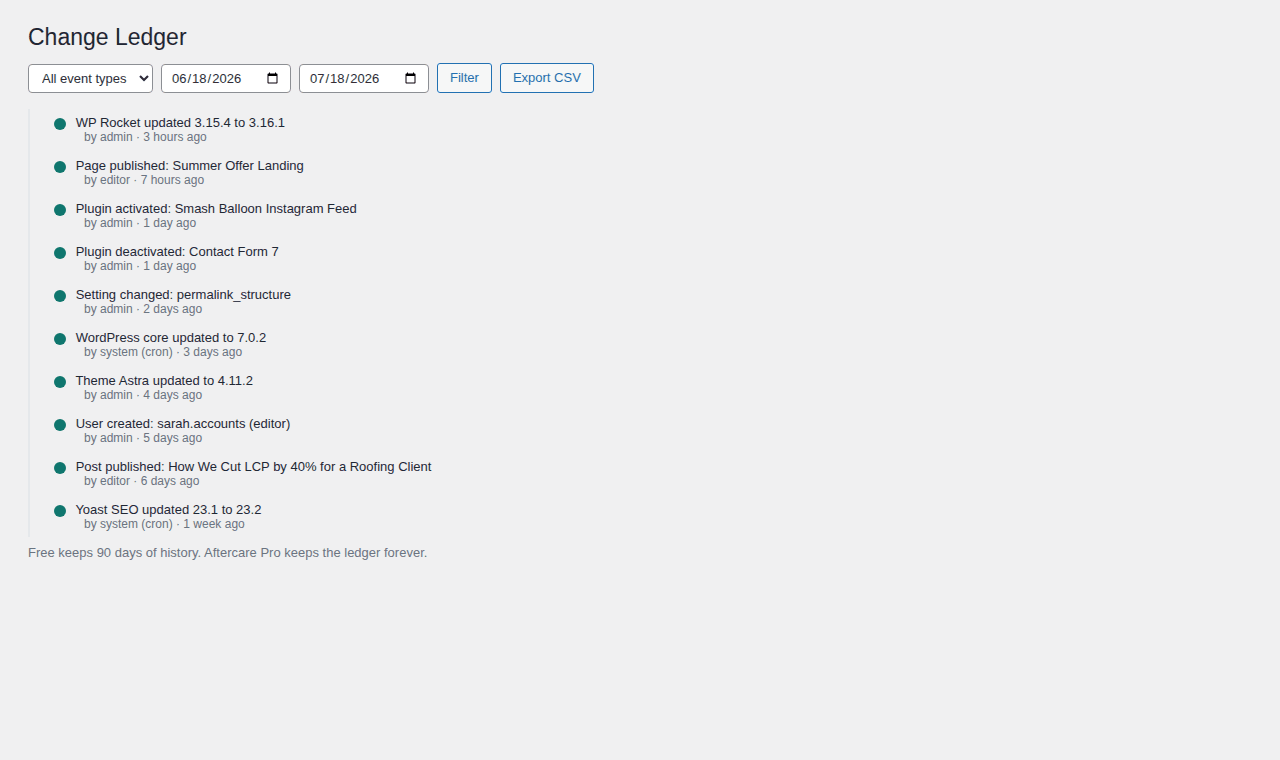
Change Ledger
A filterable timeline of every site change, with the responsible user
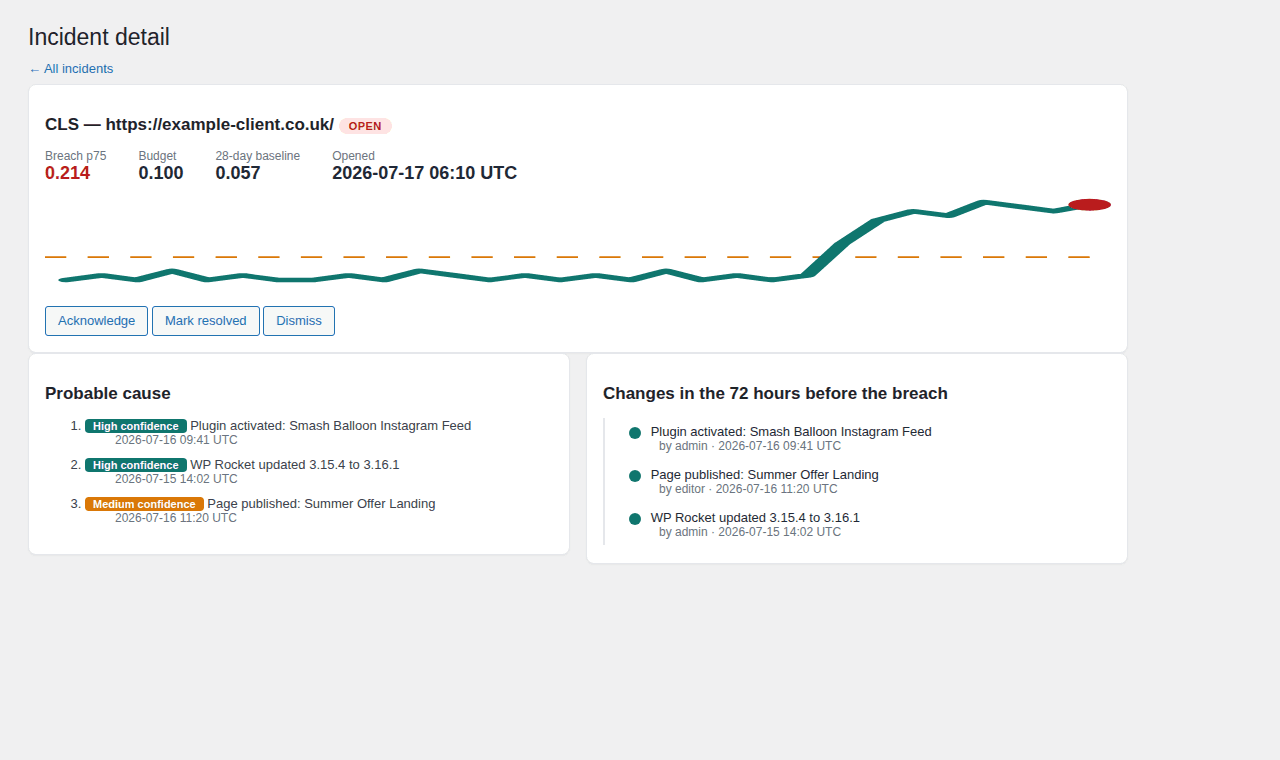
Incident Detail
Breach vs budget and baseline, with the changes from the 72 hours before
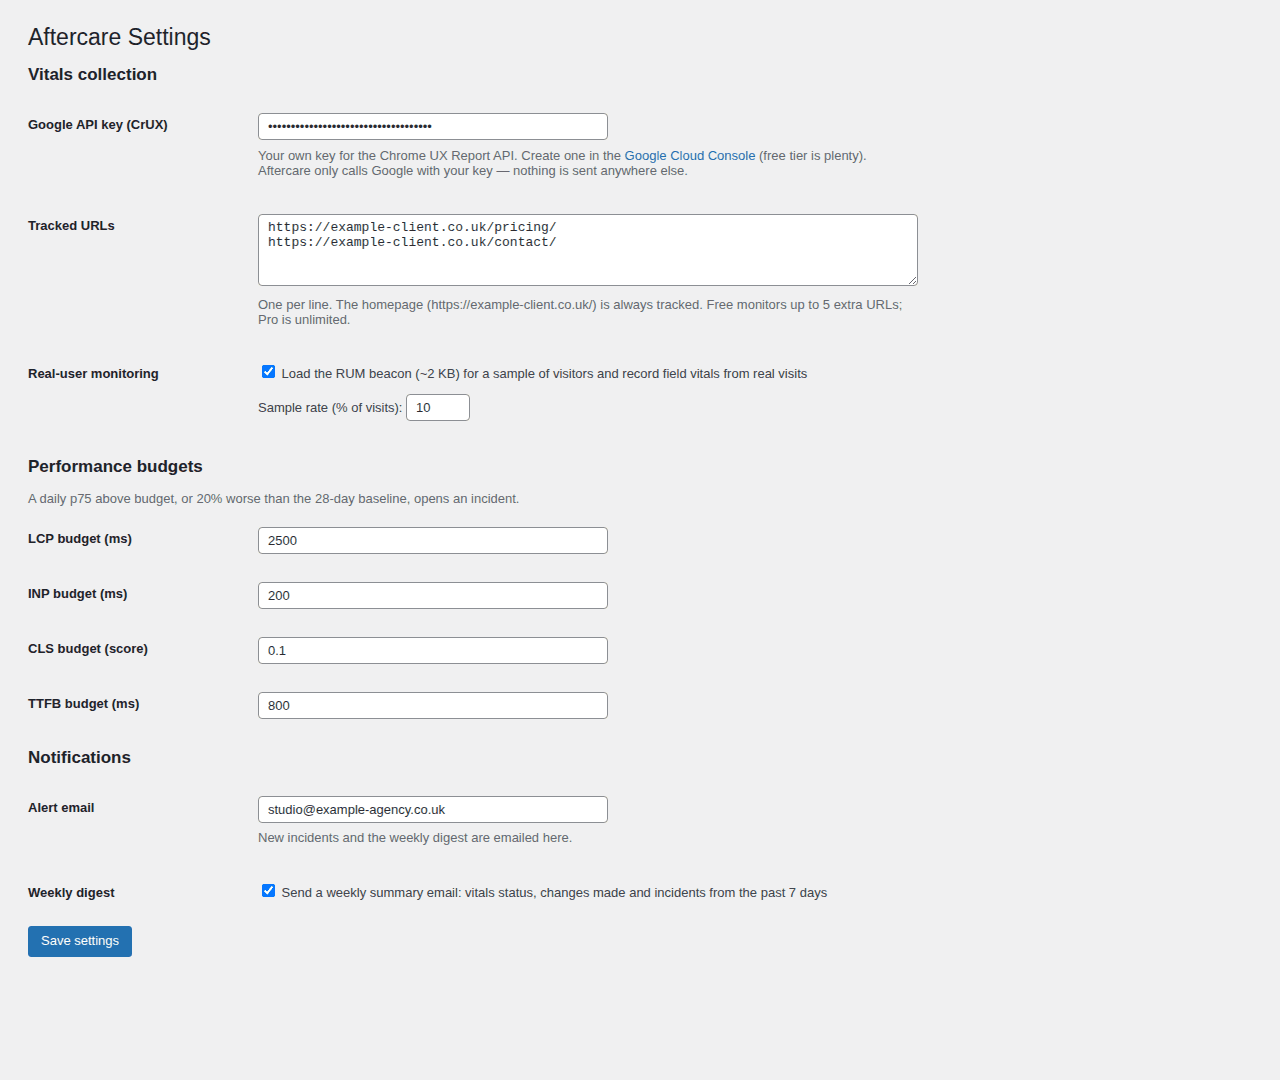
Settings
API key, tracked URLs, performance budgets and notifications
Free vs Pro
Free tells you what changed. Pro tells you which change did it.
| Feature | Aftercare (Free) | Aftercare Pro |
|---|---|---|
| Tracked URLs | Homepage + 5 | Unlimited, with per-URL budgets |
| Vitals history | 30 days | 13 months |
| Change ledger retention | 90 days | Unlimited |
| Budgets, incidents & email alerts | Included | Included |
| Lighthouse lab checks & re-test after every update | Included | Included, with the changes that triggered the re-test ranked first |
| PHP fatal error & availability watch | Included | Included, with the updated plugin or theme the error came from ranked first |
| Weekly digest email | Included | Included |
| Cause attribution | — | Changes ranked with high / medium / low confidence |
| White-label client reports | — | Monthly drafts with your logo, print/PDF and email delivery |
| Slack & webhook notifications | — | Included |
Requirements
Changelog
Next release
- Daily Lighthouse lab checks through the PageSpeed Insights API (LCP, CLS, TTFB, Total Blocking Time)
- Lab re-test 15 minutes after plugin, theme and core changes, with separate lab incidents
- PHP fatal error capture, grouped on a new PHP Errors screen with the likely culprit
- Hourly and post-update availability checks for the homepage and tracked URLs
- Error and availability incidents with email alerts; new wp aftercare lab command and Site Health test
Version 1.0.0
- Daily CrUX p75 pull (LCP, INP, CLS, TTFB) with your own Google API key
- Optional ~2 KB real-user monitoring beacon
- Performance budgets with breach detection against budget and 28-day baseline
- Incidents with status workflow and email alerts
- Change ledger for plugin/theme/core updates, settings, publishes and users
- Dashboard widget, admin bar indicator, Site Health tests, first-run guide
- WP-CLI commands: pull, check, status, run
- Weekly digest email (opt-out) and privacy-policy helper text
FAQ
Look after client sites?
Turn Aftercare's data into a monthly report clients actually read
Get the free care plan report template: updates, backups, uptime, speed and recommendations in one rebrandable document.
Catch problems before your visitors do
Start watching your site today — free.
Install Aftercare, paste a free Google API key, and get daily Core Web Vitals and lab checks, fatal error alerts, a complete change ledger and regression alerts — with nothing sent anywhere but your own site and Google.
GPL-licensed, no account, no phoning home.